> ## Documentation Index
> Fetch the complete documentation index at: https://nce-docs.bglobale.com/llms.txt
> Use this file to discover all available pages before exploring further.
# Monitoring Analytics
The Analytics section in the admin dashboard lets you monitor:
* Return activity and performance
* Customer interactions in the Return Portal
* Financial transactions related to returns
This guide describes how to access each analytics page and review key insights. You can also export data and download reports for further analysis.
## Accessing Analytics
1. Navigate to **Analytics**from the left menu.
2. Select one of the following:
* Returns
* Sessions
* Transactions
## Returns Analytics
The Returns page shows return activity during the selected timeframe.
### Accessing Returns Analytics
1. Navigate to *Analytics > Returns* from the left menu.
2. Select one of the following:
* RMA Status
* Requested
* Processed
#### Monitoring and Analyzing RMA Status
The **RMA Status**tab provides a centralized analytics dashboard for monitoring and analyzing returns activity. It presents high-level KPIs such as the number and value of RMAs, returned items, time and logistics cost savings, and Portal NPS, alongside visualizations that track trends over time and distributions by policy rules and return methods. Together, these insights enable merchants to understand returns volume, financial impact, operational efficiency, and customer experience at a glance, even clearly indicating when no data is available to ensure transparency and consistency in reporting.
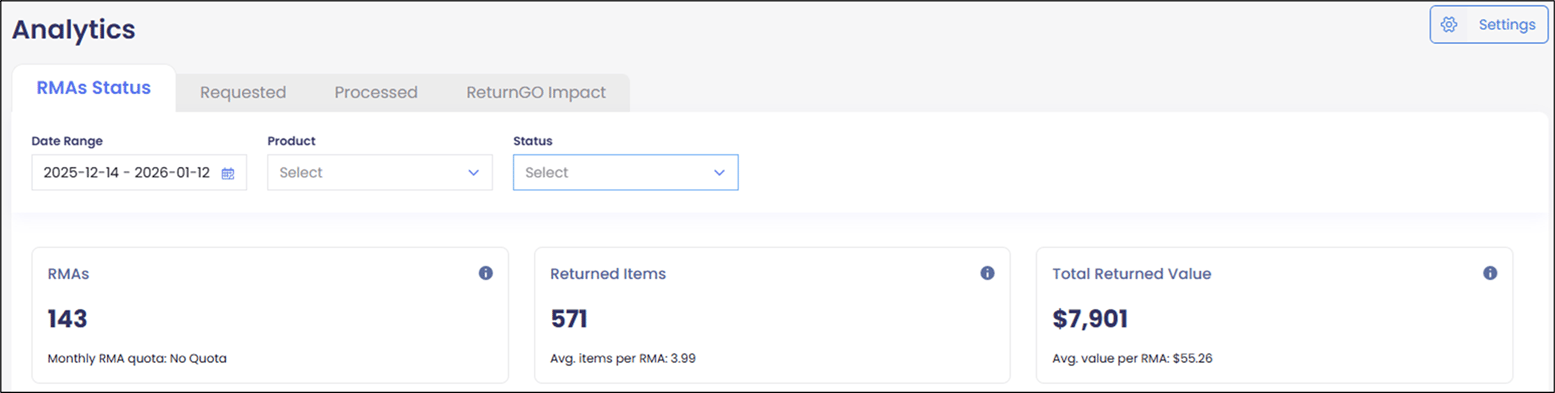 1. Select **RMA Status**.
2. Select a date range from the **Date Range** calendar.The displayed data refreshes daily.
3. Select a product from the **Product**menu.
4. Select a status from the **Status**menu.
#### Analyzing Requested Returns
The **Requested**tab provides detailed insights into retained revenue and return behavior, with flexible filtering by date range, product, return reason, and status. It highlights the total revenue retained from non-refunded items, along with the number of items retained, giving a clear view of value preserved through returns management decisions. Complementary breakdowns show the top return reasons and most-returned products by refunded item count, enabling merchants to quickly identify recurring issues, product-specific trends, and opportunities to optimize sizing, fulfillment, or policy strategies.
1. Select **RMA Status**.
2. Select a date range from the **Date Range** calendar.The displayed data refreshes daily.
3. Select a product from the **Product**menu.
4. Select a status from the **Status**menu.
#### Analyzing Requested Returns
The **Requested**tab provides detailed insights into retained revenue and return behavior, with flexible filtering by date range, product, return reason, and status. It highlights the total revenue retained from non-refunded items, along with the number of items retained, giving a clear view of value preserved through returns management decisions. Complementary breakdowns show the top return reasons and most-returned products by refunded item count, enabling merchants to quickly identify recurring issues, product-specific trends, and opportunities to optimize sizing, fulfillment, or policy strategies.
 1. Select **Requested** tab.
2. Select a date range from the **Date Range** calendar.The displayed data refreshes daily with information up to the previous day.
3. Select a product from the **Product**menu.
4. Select a status from the **Status**menu.
5. Select one of the following resolutions:
* All
* Refund
#### Analyzing Processed Returns
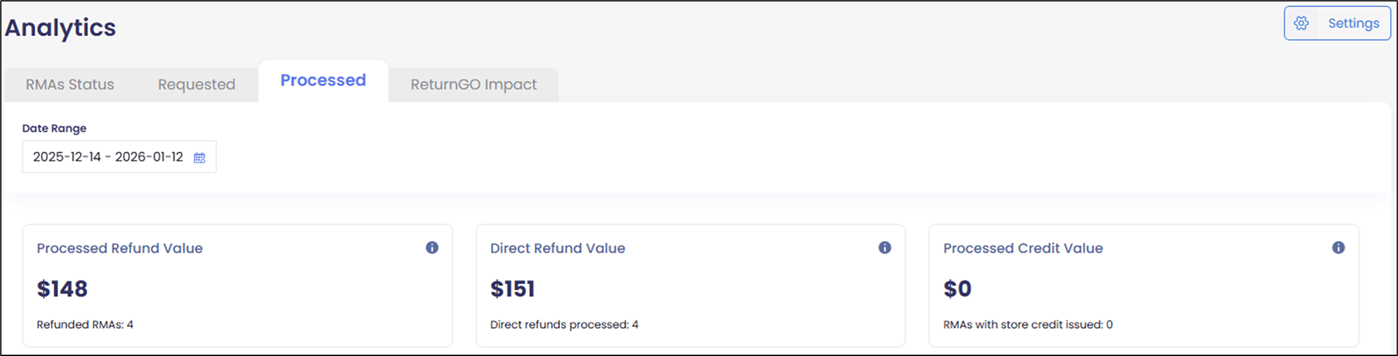
The **Processed** tab provides a comprehensive view of how returns are resolved and their financial outcomes. It summarizes the total value and volume of processed refunds. Visualizations further break down processed resolutions by type and track resolution activity over time, enabling merchants to understand customer resolution preferences, measure the refund strategies, and assess the overall revenue impact of returns processing.
1. Select **Processed** tab.
2. Select a date range from the **Date Range** calendar.The displayed data refreshes daily with information up to the previous day.
### Downloading Return Data
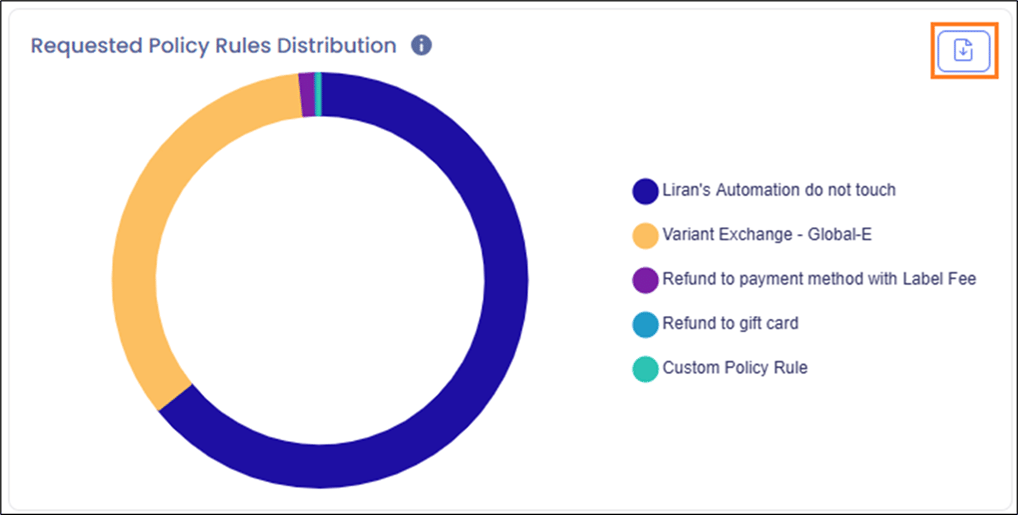
Some graphs and data displayed can be downloaded to CSV for further analysis by clicking the download:
1. Select **Requested** tab.
2. Select a date range from the **Date Range** calendar.The displayed data refreshes daily with information up to the previous day.
3. Select a product from the **Product**menu.
4. Select a status from the **Status**menu.
5. Select one of the following resolutions:
* All
* Refund
#### Analyzing Processed Returns
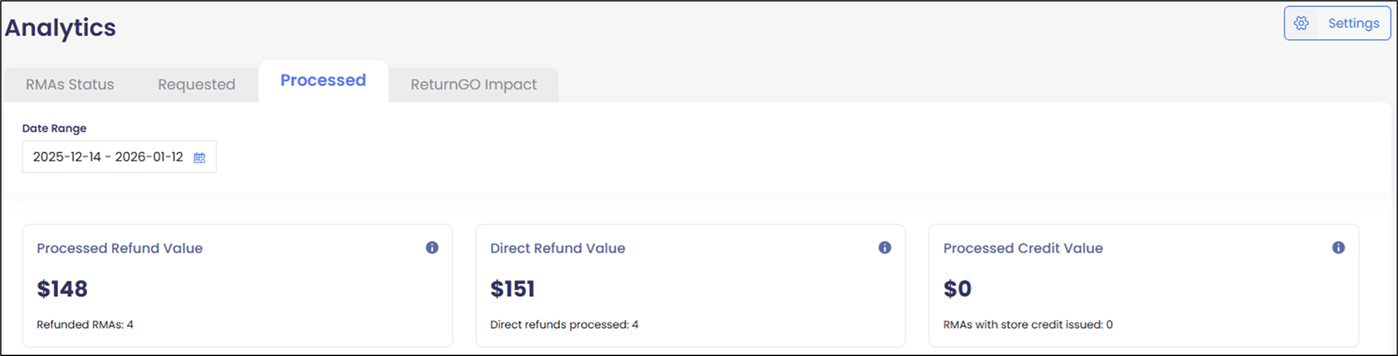
The **Processed** tab provides a comprehensive view of how returns are resolved and their financial outcomes. It summarizes the total value and volume of processed refunds. Visualizations further break down processed resolutions by type and track resolution activity over time, enabling merchants to understand customer resolution preferences, measure the refund strategies, and assess the overall revenue impact of returns processing.
1. Select **Processed** tab.
2. Select a date range from the **Date Range** calendar.The displayed data refreshes daily with information up to the previous day.
### Downloading Return Data
Some graphs and data displayed can be downloaded to CSV for further analysis by clicking the download:
 ## Sessions Analytics
The **Sessions**page shows customer interactions in the Return Portal:
## Sessions Analytics
The **Sessions**page shows customer interactions in the Return Portal:
 ### Accessing Session Analytics
1. Navigate to *Analytics > Sessions* from the left menu.
2. A table showing the following information is displayed:
* ID
* Date/Time (UTC)
* Customer ID
* Order ID
* Status
* Values
* Action
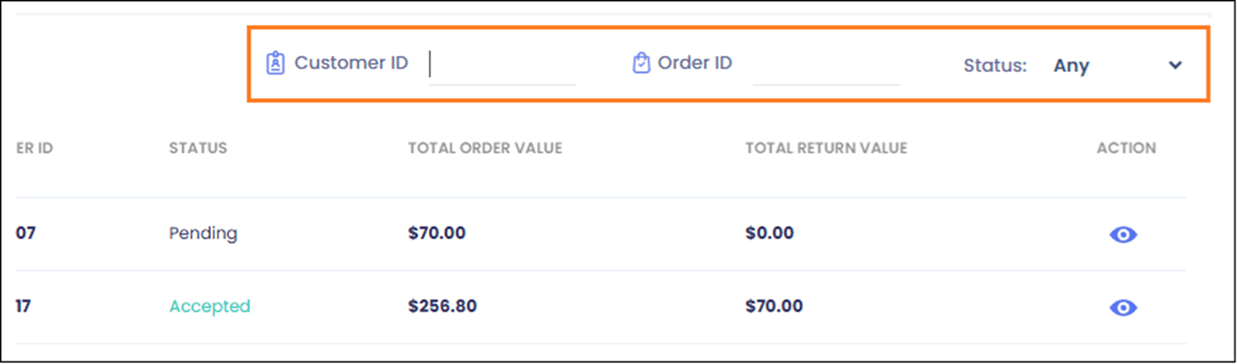
3. *Optional*- Search by **Customer ID**, **Order ID**, or **Status**:
### Accessing Session Analytics
1. Navigate to *Analytics > Sessions* from the left menu.
2. A table showing the following information is displayed:
* ID
* Date/Time (UTC)
* Customer ID
* Order ID
* Status
* Values
* Action
3. *Optional*- Search by **Customer ID**, **Order ID**, or **Status**:
 4. In the row corresponding to the ID you want to analyze, click the **Action** icon Action\_Icon.png.
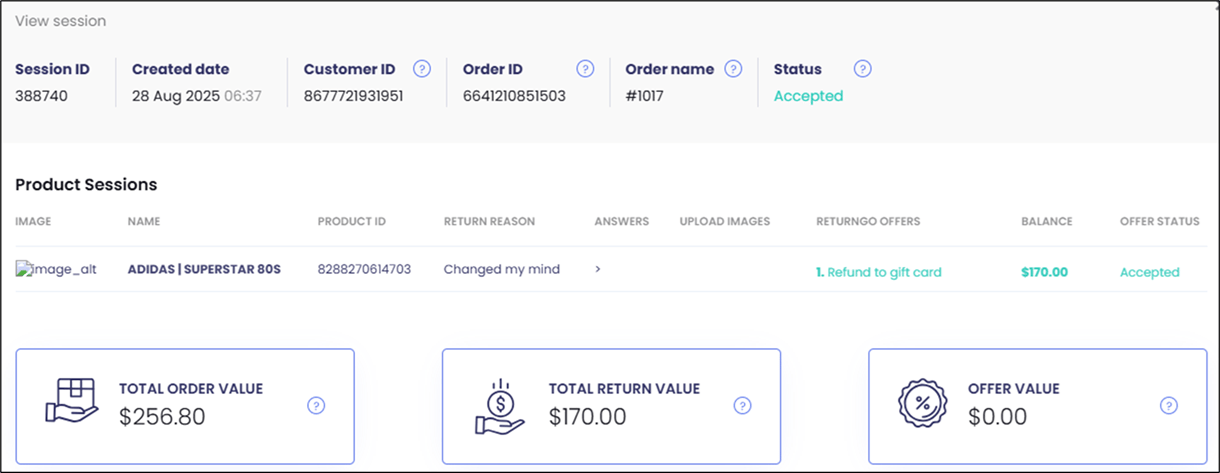
5. The session details are displayed:
4. In the row corresponding to the ID you want to analyze, click the **Action** icon Action\_Icon.png.
5. The session details are displayed:
 ## Transactions Analytics
The Transactions page shows financial activity processed through the Return Portal:
### Accessing Transactions
1. Navigate to *Analytics > Returns* from the left menu.
2. Select a date range from the **Date Range** calendar.
3. The displayed data refreshes daily with information up to the previous day.
4. Select one of the following statuses:
* Any
* Purchase
* Refund
5. A table showing the following information is displayed:
* ID
* Date & Time
* Customer ID
* Order ID
* RMA ID
* Platform Transaction ID
* Gift Cards, Money
* Action (Refund, Invoice, Purchase, Authorization, Capture)
* Status (Requested, Success, Canceled)
## Transactions Analytics
The Transactions page shows financial activity processed through the Return Portal:
### Accessing Transactions
1. Navigate to *Analytics > Returns* from the left menu.
2. Select a date range from the **Date Range** calendar.
3. The displayed data refreshes daily with information up to the previous day.
4. Select one of the following statuses:
* Any
* Purchase
* Refund
5. A table showing the following information is displayed:
* ID
* Date & Time
* Customer ID
* Order ID
* RMA ID
* Platform Transaction ID
* Gift Cards, Money
* Action (Refund, Invoice, Purchase, Authorization, Capture)
* Status (Requested, Success, Canceled)